
Chart Canvas MCP Server
Enables AI assistants to create interactive charts, diagrams, and tables displayed on a real-time dashboard, supporting multiple data sources with privacy-focused local execution.
README
Chart Canvas MCP Server
Interactive visualization dashboard for AI assistants via Model Context Protocol
Create beautiful charts, diagrams, and tables directly from your AI conversations. Chart Canvas provides a real-time dashboard that displays visualizations as you work with LLMs like Claude.
Demo
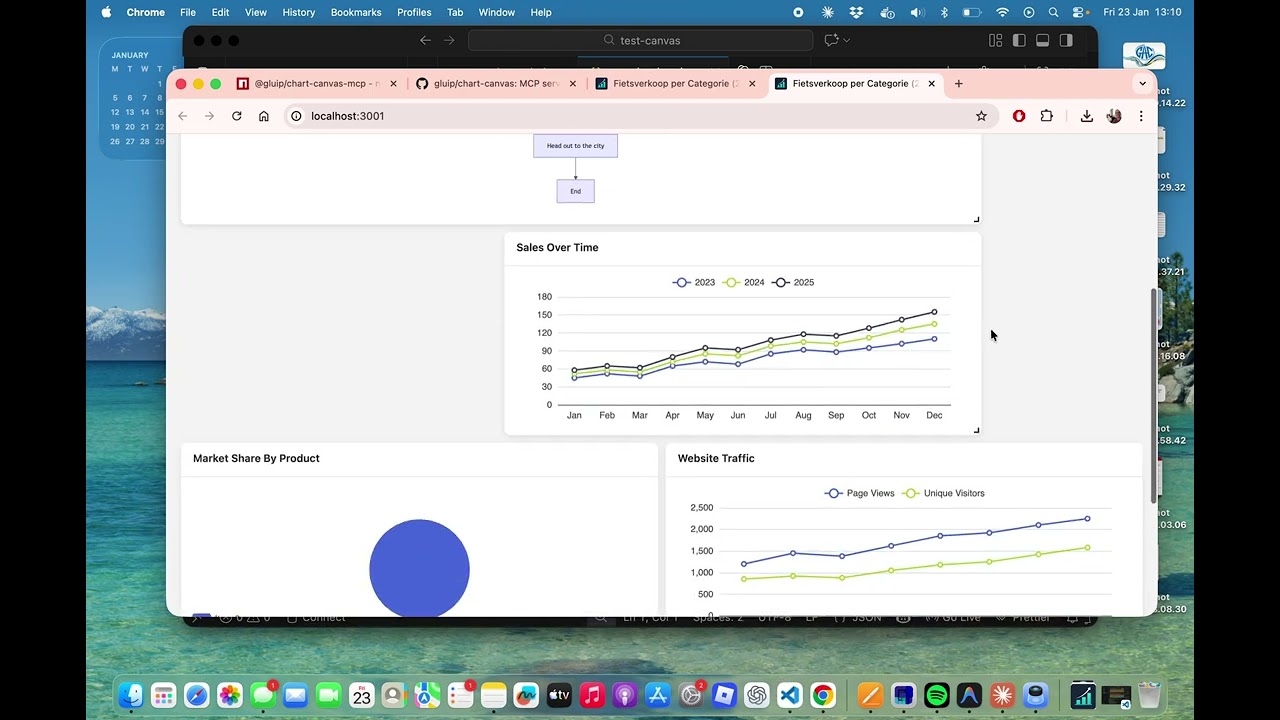
Watch the full demo on YouTube to see Chart Canvas in action!
Features
✨ Multiple Chart Types: Line, bar, scatter, pie charts, tables, and Mermaid diagrams
🎨 Interactive Dashboard: Drag-and-drop grid layout with real-time updates
🔄 Live Synchronization: Changes appear instantly in your browser
📊 Rich Visualizations: Powered by ECharts and Mermaid
💾 Universal Data Sources: Query SQLite, CSV, Parquet, JSON, and NDJSON files directly
⚡ Smart Data Flow: Execute queries server-side - data stays local, never sent to LLM
🔒 Privacy First: Your data never leaves your machine
🚀 Easy Setup: One command to get started
🌐 Production Ready: Built-in production mode with optimized builds
Supported Data Sources
Chart Canvas can query and visualize data from multiple file formats:
- SQLite (
.db,.sqlite,.sqlite3) - Relational databases - CSV (
.csv) - Comma-separated values - Parquet (
.parquet) - Columnar storage format - JSON (
.json) - JSON arrays of objects - NDJSON (
.jsonl,.ndjson) - Newline-delimited JSON
Privacy & Performance: All queries execute locally on your machine using DuckDB. Query results are transformed into visualizations server-side - only metadata (chart configuration) is sent to the LLM, never your actual data. This makes it fast, scalable, and private.
Quick Start
Installation
npm install -g @gluip/chart-canvas-mcp
Or use directly with npx (no installation needed):
npx @gluip/chart-canvas-mcp
Configuration
Add to your MCP client configuration (e.g., Claude Desktop):
macOS: ~/Library/Application Support/Claude/claude_desktop_config.json
Windows: %APPDATA%/Claude/claude_desktop_config.json
{
  "mcpServers": {
    "chart-canvas": {
      "command": "npx",
      "args": ["-y", "@gluip/chart-canvas-mcp"]
    }
  }
}
Usage
- Start your MCP client (e.g., Claude Desktop)
- The server will automatically start on port 3000
- Use the
showCanvastool to open the dashboard in your browser - Ask the AI to create visualizations!
Example Prompts
"Show me a line chart comparing sales data for 2023 and 2024"

"Create a pie chart showing market share by region"

"Draw a flowchart for the user authentication process"

"Make a table with team member information"

"Show me the database schema for my SQLite database"

"Query the athletes table and show the top 10 with most personal records"

"Create a chart showing sales trends from the database grouped by region"
MCP Tools
addVisualization
Create charts, diagrams, and tables on the canvas.
Supported Types:
line- Line charts with multiple seriesbar- Bar charts for comparisonsscatter- Scatter plots for data distributionpie- Pie charts with labelstable- Data tables with headersflowchart- Mermaid diagrams (flowcharts, sequence diagrams, Gantt charts, etc.)
Example:
{
  type: "line",
  title: "Monthly Sales",
  series: [
    { name: "2023", data: [[1, 120], [2, 132], [3, 101]] },
    { name: "2024", data: [[1, 220], [2, 182], [3, 191]] }
  ],
  xLabels: ["Jan", "Feb", "Mar"]
}
removeVisualization
Remove a specific visualization by ID.
clearCanvas
Remove all visualizations from the canvas.
showCanvas
Open the dashboard in your default browser.
getDatabaseSchema
Inspect the structure of a SQLite database to understand available tables and columns before writing queries.
Parameters:
databasePath- Path to SQLite database file (e.g.,./data/mydb.sqliteor absolute path)
Example:
{
  databasePath: "/path/to/database.db";
}
Returns: Formatted schema showing all tables, columns, data types, and constraints.
queryAndVisualize
Execute a SQL query on a SQLite database and create a visualization from the results. Queries are executed server-side and must be read-only (SELECT only). Maximum 10,000 rows.
Parameters:
databasePath- Path to SQLite database filequery- SQL SELECT query (read-only)visualizationType- Type of chart:line,bar,scatter,pie, ortablecolumnMapping(optional for table) - Mapping of columns to chart axes:xColumn- Column for X-axis (required for charts)yColumns- Array of columns for Y-axis (required for charts)seriesColumn- Column to group data into separate series (optional)groupByColumn- Alternative grouping column (optional)
title- Optional title for visualizationdescription- Optional descriptionuseColumnAsXLabel- If true, use X column values as labels instead of numbers
Example:
{
  databasePath: "./data/sales.db",
  query: "SELECT region, SUM(revenue) as total FROM sales GROUP BY region",
  visualizationType: "bar",
  columnMapping: {
    xColumn: "region",
    yColumns: ["total"]
  },
  title: "Revenue by Region",
  useColumnAsXLabel: true
}
Security: Only SELECT and WITH (CTE) queries are allowed. INSERT, UPDATE, DELETE, DROP, and other modifying operations are blocked.
Architecture
- Backend: Node.js + TypeScript + Express + MCP SDK
- Frontend: Vue 3 + ECharts + Mermaid + Grid Layout
- Communication: Real-time polling for instant updates
Development
Local Development
# Clone repository
git clone https://github.com/gluip/chart-canvas.git
cd chart-canvas

# Install backend dependencies
cd backend
npm install

# Install frontend dependencies
cd ../frontend
npm install

# Development mode (backend + frontend separate)
# Terminal 1 - Backend
cd backend
npm run dev

# Terminal 2 - Frontend
cd frontend
npm run dev

# Production mode (single server)
cd backend
npm run build:all
npm run start:prod
MCP Configuration for Local Development
{
  "mcpServers": {
    "chart-canvas": {
      "command": "/path/to/node",
      "args": [
        "/path/to/chart-canvas/backend/node_modules/.bin/tsx",
        "/path/to/chart-canvas/backend/src/index.ts"
      ]
    }
  }
}
License
MIT © 2026 Martijn
Links
推荐服务器

Baidu Map
百度地图核心API现已全面兼容MCP协议,是国内首家兼容MCP协议的地图服务商。

Playwright MCP Server
一个模型上下文协议服务器,它使大型语言模型能够通过结构化的可访问性快照与网页进行交互,而无需视觉模型或屏幕截图。

Audiense Insights MCP Server
通过模型上下文协议启用与 Audiense Insights 账户的交互,从而促进营销洞察和受众数据的提取和分析,包括人口统计信息、行为和影响者互动。

Magic Component Platform (MCP)
一个由人工智能驱动的工具,可以从自然语言描述生成现代化的用户界面组件,并与流行的集成开发环境(IDE)集成,从而简化用户界面开发流程。

VeyraX
一个单一的 MCP 工具,连接你所有喜爱的工具:Gmail、日历以及其他 40 多个工具。

Kagi MCP Server
一个 MCP 服务器,集成了 Kagi 搜索功能和 Claude AI,使 Claude 能够在回答需要最新信息的问题时执行实时网络搜索。

graphlit-mcp-server
模型上下文协议 (MCP) 服务器实现了 MCP 客户端与 Graphlit 服务之间的集成。 除了网络爬取之外,还可以将任何内容(从 Slack 到 Gmail 再到播客订阅源)导入到 Graphlit 项目中,然后从 MCP 客户端检索相关内容。

Neon MCP Server
用于与 Neon 管理 API 和数据库交互的 MCP 服务器

Exa MCP Server
模型上下文协议(MCP)服务器允许像 Claude 这样的 AI 助手使用 Exa AI 搜索 API 进行网络搜索。这种设置允许 AI 模型以安全和受控的方式获取实时的网络信息。

mcp-server-qdrant
这个仓库展示了如何为向量搜索引擎 Qdrant 创建一个 MCP (Managed Control Plane) 服务器的示例。