Optuna MCP Server
A Model Context Protocol server that enables automated optimization and analysis using Optuna, allowing LLMs to perform hyperparameter optimization and interactively analyze optimization results via chat interfaces.
README
Optuna MCP Server

![]()
![]()
A Model Context Protocol (MCP) server that automates optimization and anlysis using Optuna.
<img width="840" alt="image" src="https://raw.githubusercontent.com/optuna/optuna-mcp/main/examples/sphere2d/images/sphere2d-6.png" />
Use Cases
The Optuna MCP Server can be used in the following use cases, for example.
- Automated hyperparameter optimization by LLMs
- Interactive analysis of Optuna's optimization results via chat interface
- Optimize input and output of other MCP tools
For details, see the Examples section.
Installation
The Optuna MCP server can be installed using uv or Docker.
This section explains how to install the Optuna MCP server, using Claude Desktop as an example MCP client.
Usage with uv
Before starting the installation process, install uv from Astral.
Then, add the Optuna MCP server configuration to the MCP client.
To include it in Claude Desktop, go to Claude > Settings > Developer > Edit Config > claude_desktop_config.json
and add the following:
{
  "mcpServers": {
    "Optuna": {
      "command": "uvx",
      "args": [
        "optuna-mcp"
      ]
    }
  }
}
Additionally, you can specify the Optuna storage with the --storage argument to persist the results.
{
  "mcpServers": {
    "Optuna": {
      "command": "uvx",
      "args": [
        "optuna-mcp"
        "--storage",
        "sqlite:///optuna.db"
      ]
    }
  }
}
After adding this, please restart Claude Desktop application. For more information about Claude Desktop, check out the quickstart page.
Usage with Docker
You can also run the Optuna MCP server using Docker. Make sure you have Docker installed and running on your machine.
{
  "mcpServers": {
    "Optuna": {
      "command": "docker",
      "args": [
        "run",
        "-i",
        "--rm",
        "--net=host",
        "-v",
        "/PATH/TO/LOCAL/DIRECTORY/WHICH/INCLUDES/DB/FILE:/app/workspace",
        "optuna/optuna-mcp:latest",
        "--storage",
        "sqlite:////app/workspace/optuna.db"
      ]
    }
  }
}
Tools provided by Optuna MCP
The Optuna MCP provides the following tools. Specifically, it offers primitive functions of Optuna such as Study, Trial, Visualization, and Dashboard. Since MCP clients know the list of tools and the details of each tool, users do not need to remember those details.
Study
- create_study - Create a new Optuna study with the given study_name and directions.
If the study already exists, it will be simply loaded.
study_name: name of the study (string, required).directions: The directions of optimization (list of literal strings minimize/maximize, optional).
- set_sampler - Set the sampler for the study.
name: the name of the sampler (string, required).
- get_all_study_names - Get all study names from the storage.
- set_metric_names - Set metric_names. Metric_names are labels used to distinguish what each objective value is.
metric_names: The list of metric names for each objective (list of strings, required).
- get_metric_names - Get metric_names.
- No parameters required.
- get_directions - Get the directions of the study.
- No parameters required.
- get_trials - Get all trials in a CSV format.
- No parameters required.
- best_trial - Get the best trial.
- No parameters required.
- best_trials - Return trials located at the Pareto front in the study.
- No parameters required.
Trial
- ask - Suggest new parameters using Optuna.
search_space: the search space for Optuna (dictionary, required).
- tell - Report the result of a trial.
trial_number: the trial number (integer, required).values: the result of the trial (float or list of floats, required).
- set_trial_user_attr - Set user attributes for a trial.
trial_number: the trial number (integer, required).key: the key of the user attribute (string, required).value: the value of the user attribute (any type, required).
- get_trial_user_attrs - Get user attributes in a trial.
trial_number: the trial number (integer, required).
Visualization
- plot_optimization_history - Return the optimization history plot as an image.
target: index to specify which value to display (integer, optional).target_name: target’s name to display on the axis label (string, optional).
- plot_hypervolume_history - Return the hypervolume history plot as an image.
reference_point: a list of reference points to calculate the hypervolume (list of floats, required).
- plot_pareto_front - Return the Pareto front plot as an image for multi-objective optimization.
target_names: objective name list used as the axis titles (list of strings, optional).include_dominated_trials: a flag to include all dominated trial's objective values (boolean, optional).targets: a list of indices to specify the objective values to display. (list of integers, optional).
- plot_contour - Return the contour plot as an image.
params: parameter list to visualize (list of strings, optional).target: an index to specify the value to display (integer, required).target_name: target’s name to display on the color bar (string, required).
- plot_parallel_coordinate - Return the parallel coordinate plot as an image.
params: parameter list to visualize (list of strings, optional).target: an index to specify the value to display (integer, required).target_name: target’s name to display on the axis label and the legend (string, required).
- plot_slice - Return the slice plot as an image.
params: parameter list to visualize (list of strings, optional).target: an index to specify the value to display (integer, required).target_name: target’s name to display on the axis label (string, required).
- plot_param_importances - Return the parameter importances plot as an image.
params: parameter list to visualize (list of strings, optional).target: an index to specify the value to display (integer/null, optional).target_name: target’s name to display on the legend (string, required).
- plot_edf - Return the EDF plot as an image.
target: an index to specify the value to display (integer, required).target_name: target’s name to display on the axis label (string, required).
- plot_timeline - Return the timeline plot as an image.
- No parameters required.
- plot_rank - Return the rank plot as an image.
params: parameter list to visualize (list of strings, optional).target: an index to specify the value to display (integer, required).target_name: target’s name to display on the color bar (string, required).
Web Dashboard
- launch_optuna_dashboard - Launch the Optuna dashboard.
port: server port (integer, optional, default: 58080).
Examples
- Optimizing the 2D-Sphere function
- Starting the Optuna dashboard and analyzing optimization results
- Optimizing the FFmpeg encoding parameters
- Optimizing the Cookie Recipe
- Optimizing the Matplotlib Configuration
Optimizing the 2D-Sphere Function
Here we present a simple example of optimizing the 2D-Sphere function, along with example prompts and the summary of the LLM responses.
| User prompt | Output in Claude |
|---|---|
| (Launch Claude Desktop) | <img alt="1" src="https://raw.githubusercontent.com/optuna/optuna-mcp/main/examples/sphere2d/images/sphere2d-1.png" /> |
| Please create an Optuna study named "Optimize-2D-Sphere" for minimization. | <img alt="2" src="https://raw.githubusercontent.com/optuna/optuna-mcp/main/examples/sphere2d/images/sphere2d-2.png" /> |
| Please suggest two float parameters x, y in [-1, 1]. | <img alt="3" src="https://raw.githubusercontent.com/optuna/optuna-mcp/main/examples/sphere2d/images/sphere2d-3.png" /> |
| Please report the objective value x**2 + y**2. To calculate the value, please use the JavaScript interpreter and do not round the values. | <img alt="4" src="https://raw.githubusercontent.com/optuna/optuna-mcp/main/examples/sphere2d/images/sphere2d-4.png" /> |
| Please suggest another parameter set and evaluate it. | <img alt="5" src="https://raw.githubusercontent.com/optuna/optuna-mcp/main/examples/sphere2d/images/sphere2d-5.png" /> |
| Please plot the optimization history so far. | <img alt="6" src="https://raw.githubusercontent.com/optuna/optuna-mcp/main/examples/sphere2d/images/sphere2d-6.png" /> |
Starting the Optuna Dashboard and Analyzing Optimization Results
You can also start the Optuna dashboard via the MCP server to analyze the optimization results interactively.
| User prompt | Output in Claude |
|---|---|
| Please launch the Optuna dashboard. | <img alt="7" src="https://raw.githubusercontent.com/optuna/optuna-mcp/main/examples/optuna-dashboard/images/optuna-dashboard-1.png" /> |
By default, the Optuna dashboard will be launched on port 58080.
You can access it by navigating to http://localhost:58080 in your web browser as shown below:
<img alt="8" src="https://raw.githubusercontent.com/optuna/optuna-mcp/main/examples/optuna-dashboard/images/optuna-dashboard-2.png" />
Optuna dashboard provides various visualizations to analyze the optimization results, such as optimization history, parameter importances, and more.
Optimizing the FFmpeg Encoding Parameters
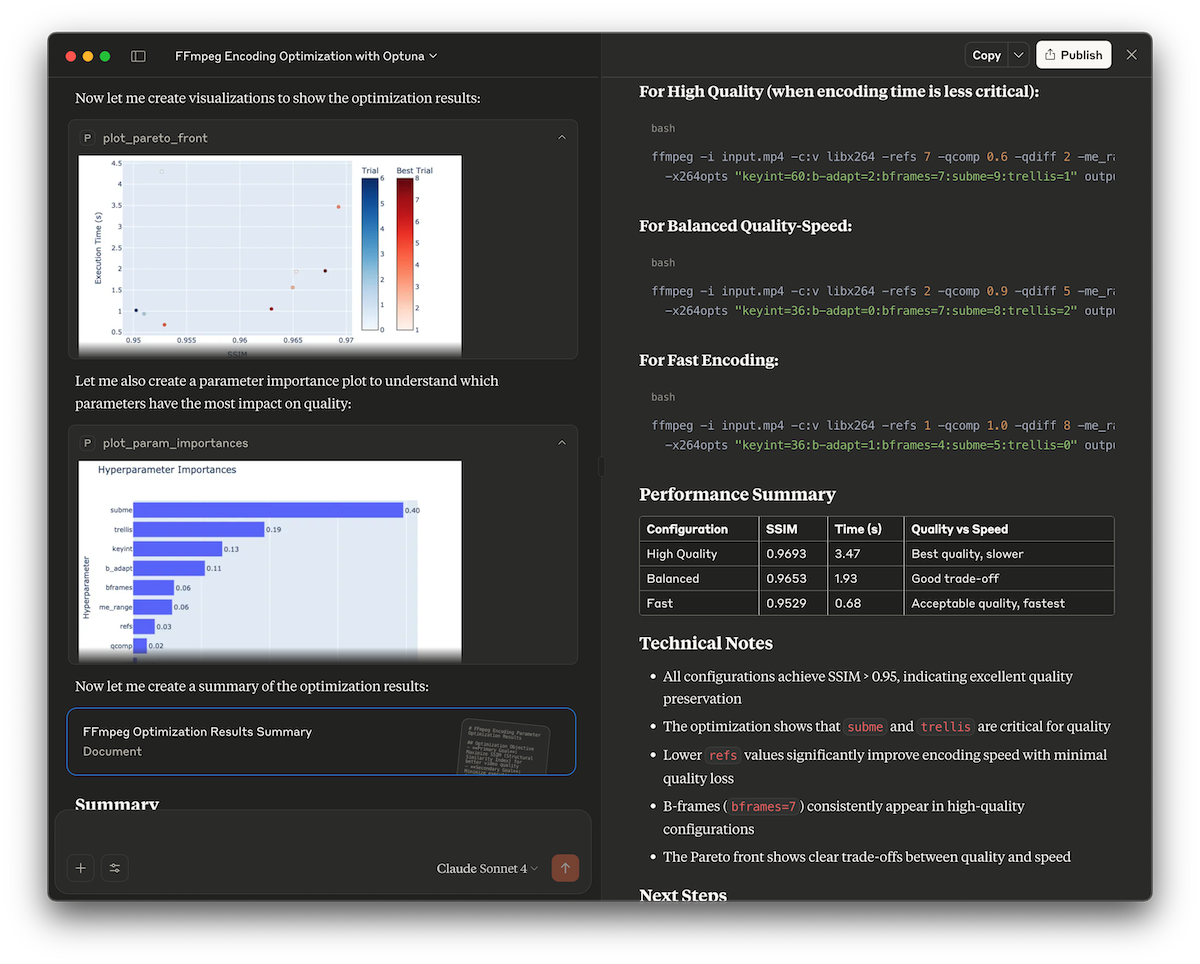
This demo showcases how to use the Optuna MCP server to automatically find optimal FFmpeg encoding parameters. It optimizes x264 encoding options to maximize video quality (measured by the SSIM score) while keeping encoding time reasonable.
Check out examples/ffmpeg.md for details.
Optimizing the Cookie Recipe
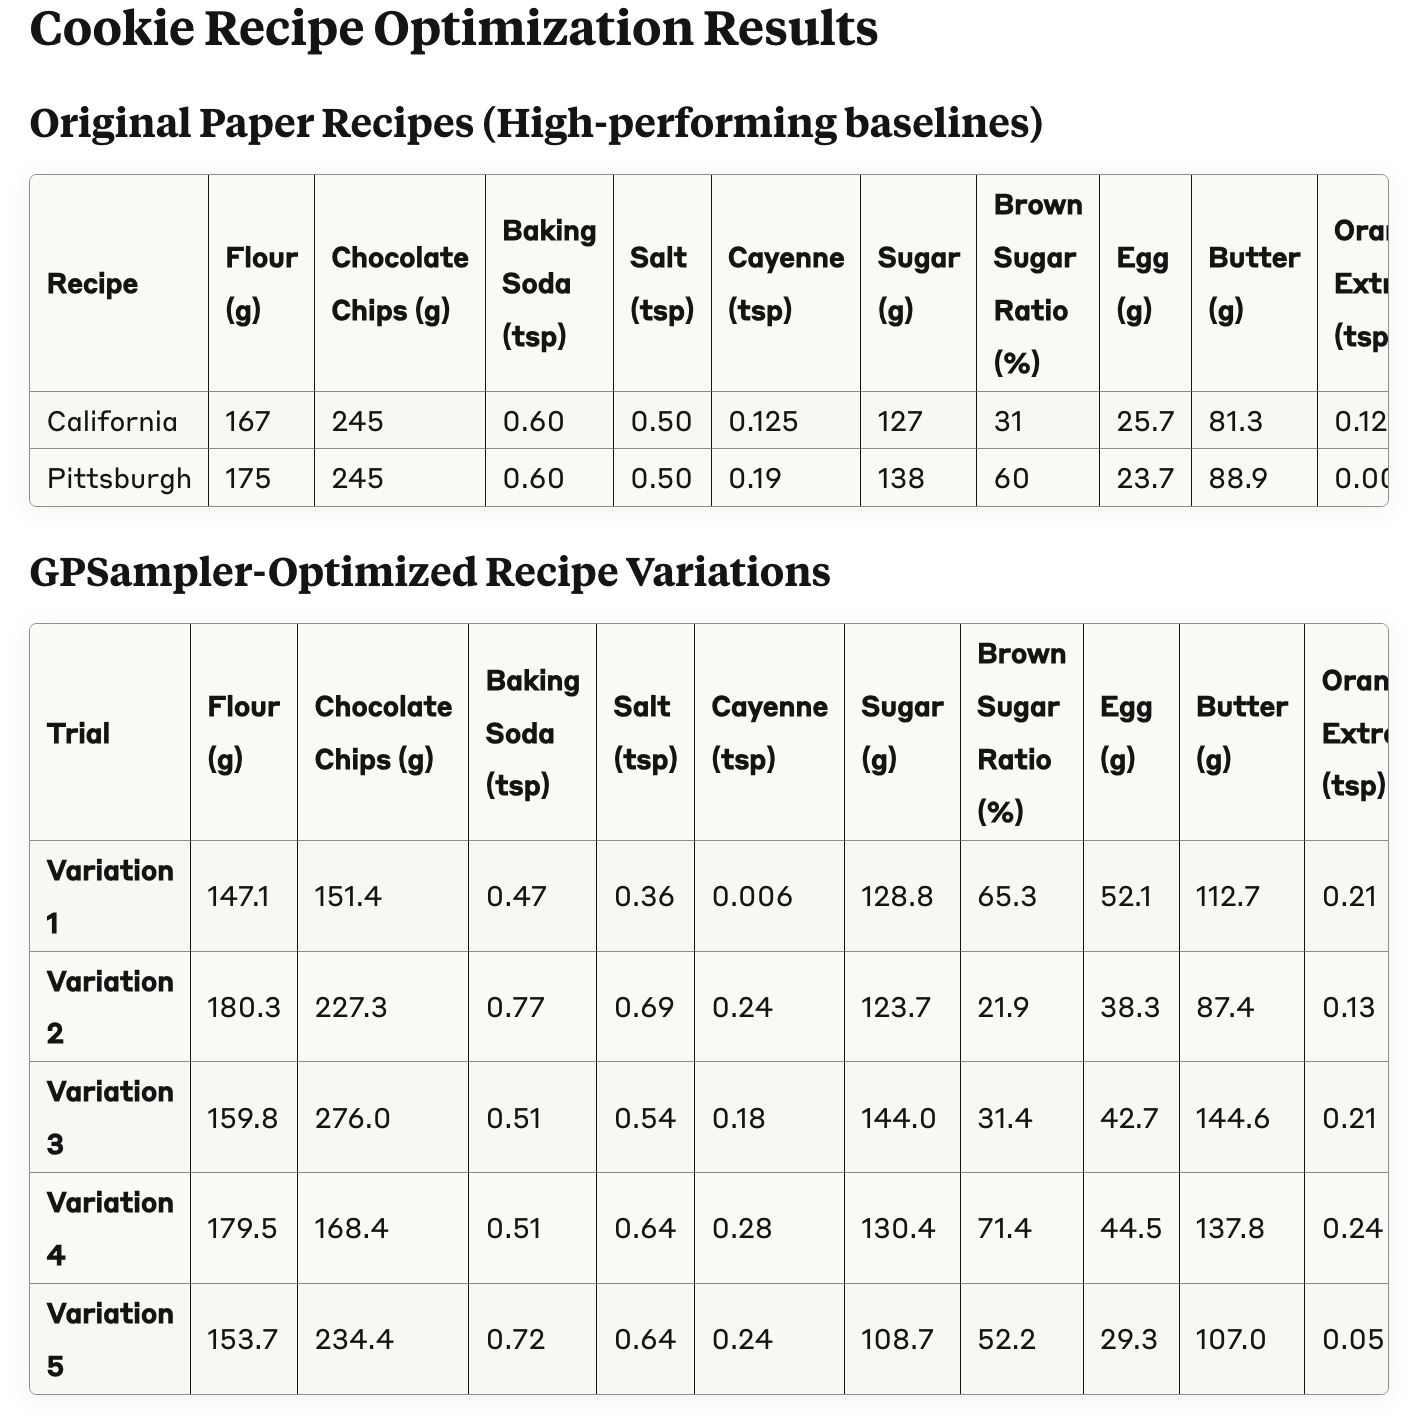
In this example, we will optimize a cookie recipe, referencing the paper titled "Bayesian Optimization for a Better Dessert".
Check out examples/cookie-recipe for details.
Optimizing the Matplotlib Configuration
<table> <caption>Default and optimized figures by Optuna MCP.</caption> <tr> <td><img src="https://raw.githubusercontent.com/optuna/optuna-mcp/main/examples/auto-matplotlib/images/first-plot.png" alt=""></td> <td><img src="https://raw.githubusercontent.com/optuna/optuna-mcp/main/examples/auto-matplotlib/images/best-plot.png" alt=""></td> </tr> </table>
This example optimizes a Matplotlib configuration.
Check out examples/auto-matplotlib for details.
License
MIT License (see LICENSE).
推荐服务器
Baidu Map
百度地图核心API现已全面兼容MCP协议,是国内首家兼容MCP协议的地图服务商。
Playwright MCP Server
一个模型上下文协议服务器,它使大型语言模型能够通过结构化的可访问性快照与网页进行交互,而无需视觉模型或屏幕截图。
Magic Component Platform (MCP)
一个由人工智能驱动的工具,可以从自然语言描述生成现代化的用户界面组件,并与流行的集成开发环境(IDE)集成,从而简化用户界面开发流程。
Audiense Insights MCP Server
通过模型上下文协议启用与 Audiense Insights 账户的交互,从而促进营销洞察和受众数据的提取和分析,包括人口统计信息、行为和影响者互动。
VeyraX
一个单一的 MCP 工具,连接你所有喜爱的工具:Gmail、日历以及其他 40 多个工具。
graphlit-mcp-server
模型上下文协议 (MCP) 服务器实现了 MCP 客户端与 Graphlit 服务之间的集成。 除了网络爬取之外,还可以将任何内容(从 Slack 到 Gmail 再到播客订阅源)导入到 Graphlit 项目中,然后从 MCP 客户端检索相关内容。
Kagi MCP Server
一个 MCP 服务器,集成了 Kagi 搜索功能和 Claude AI,使 Claude 能够在回答需要最新信息的问题时执行实时网络搜索。
e2b-mcp-server
使用 MCP 通过 e2b 运行代码。
Neon MCP Server
用于与 Neon 管理 API 和数据库交互的 MCP 服务器
Exa MCP Server
模型上下文协议(MCP)服务器允许像 Claude 这样的 AI 助手使用 Exa AI 搜索 API 进行网络搜索。这种设置允许 AI 模型以安全和受控的方式获取实时的网络信息。